We have a number of git repositories at my work. I'm a git admin, and I thought it would be interesting to see how much various people have contributed. The first thing you'll find in searching for tools like that is dozens of re-implementations of GitHub's Activity Graph - which shows how much an individual author has contributed to all repos over the last year. Not what I was looking for. Disturbingly, the second thing I found was a way to game that system: https://github.com/Shpota/github-activity-generator . <shudder> But eventually I found what I was looking for: a way to look at a given repository and graph the contributions of multiple authors over time. It seems the two main choices in this category are git-of-theseus and the similar (and equally mythic/heroic) hercules. I thought git-of-theseus looked better, so I tried it out. It's easily installed with pip3 install git-of-theseus ... and you're done.
Go to https://github.com/erikbern/git-of-theseus and check out the example graphs they're showing off. They look nice, and it's interesting as it shows progress and authorship on major projects (node, the Linux kernel, git itself). But let me tell you ... it gets really interesting when it gets personal. When it's code you use, or code you write ... this is fascinating stuff. To my surprise, this can be seriously educational even about single-user repos: it tells you about what file extensions you're using over time, how much code you've added in what year, and how much of the code has been rewritten.
Let's take a look at the biggest success first:
graph: Authors contributing to a large git repository
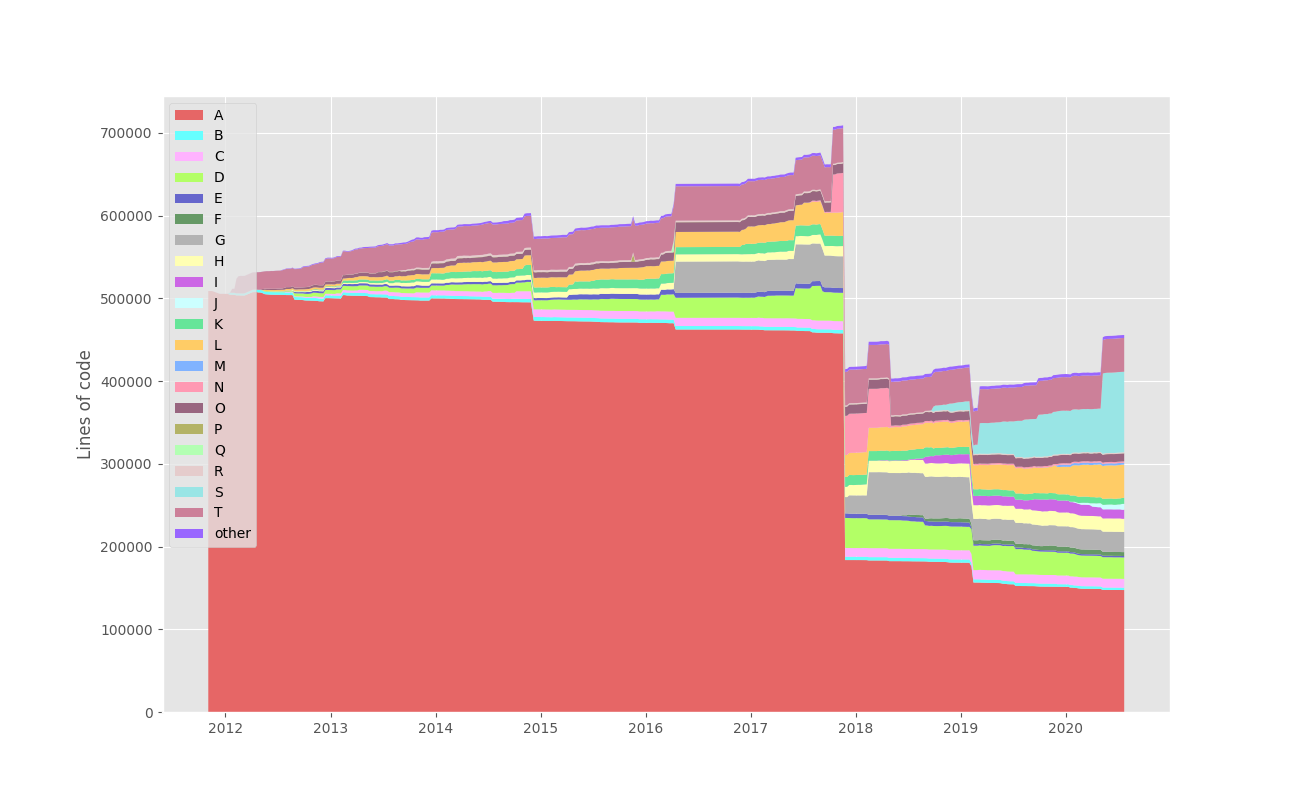
(Yes, I anonymized the author names.) It's important to remember this isn't the amount of code contributed year-over-year: this is how much code written by each individual still exists in the repository at the stated time.
I think I'm author "T" in there: back in 2012, I was working on this website a lot, but by 2014 I'd moved to a different role and now I hardly ever touch this repository. And yes, prior to 2012, the website was written almost entirely by "A", with a major site rewrite eliminating a lot of their code in late 2017. But the two things I find most interesting on this graph are "N" and "S". They're both consultants: "N" was with us for a short time around the beginning of 2018, but all the code they wrote was shortly rewritten. And then there's "S," who's been a major recent contributor who's really moved our site forward.
graph: yearly code added to a large git repository
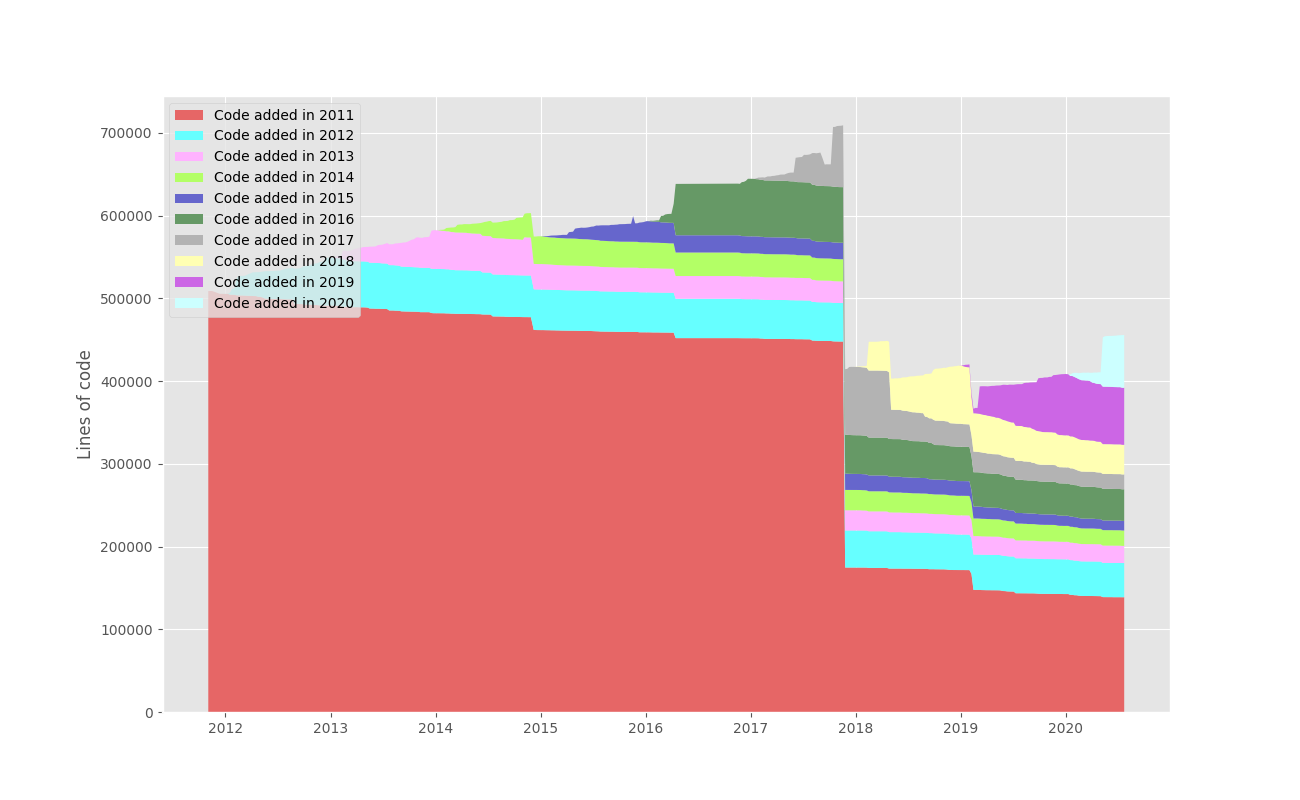
This shows us how much code was added each year from 2012 onward (and how much of it has survived until today).
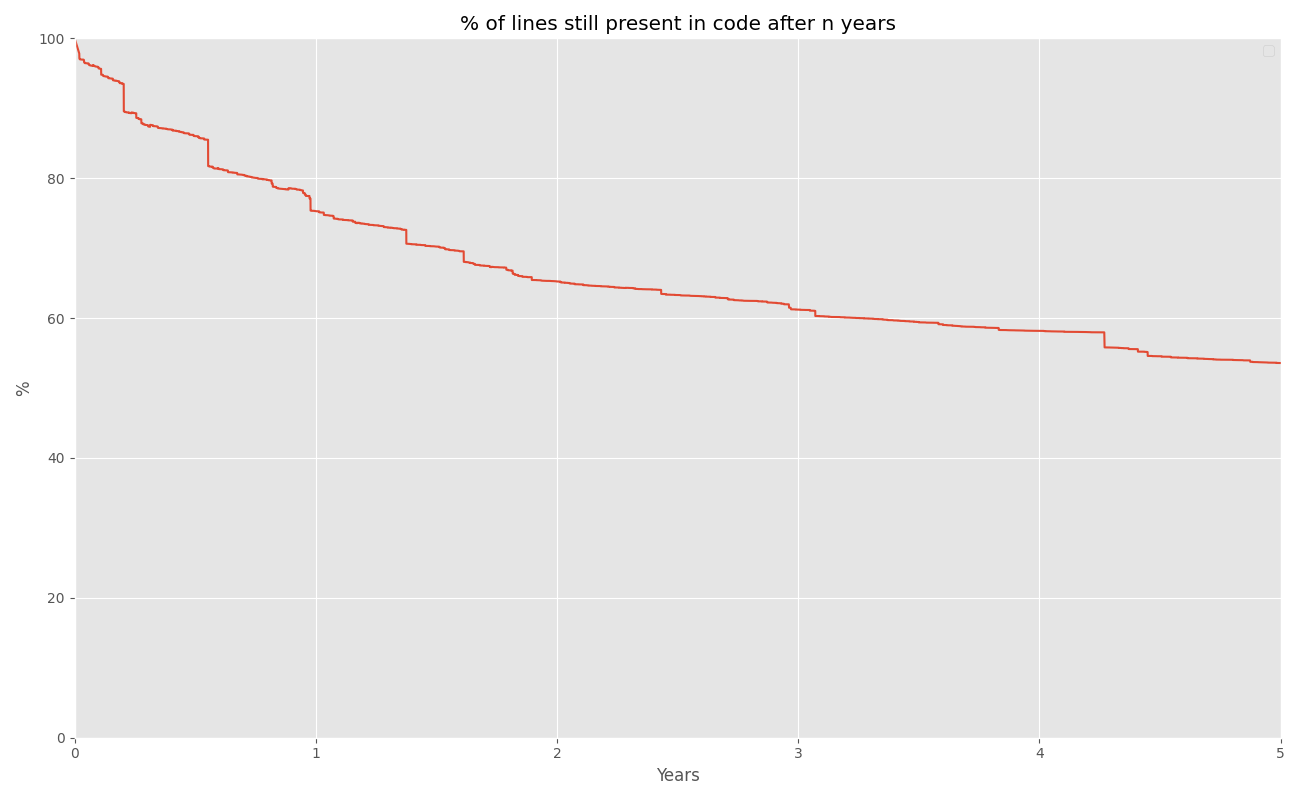
Here's a comparison for you - let's look at code survival in this repository compared to another one.
graph: code survival in our large git repository (same repository as the previous two graphs)
graph: code survival in a smaller git repository
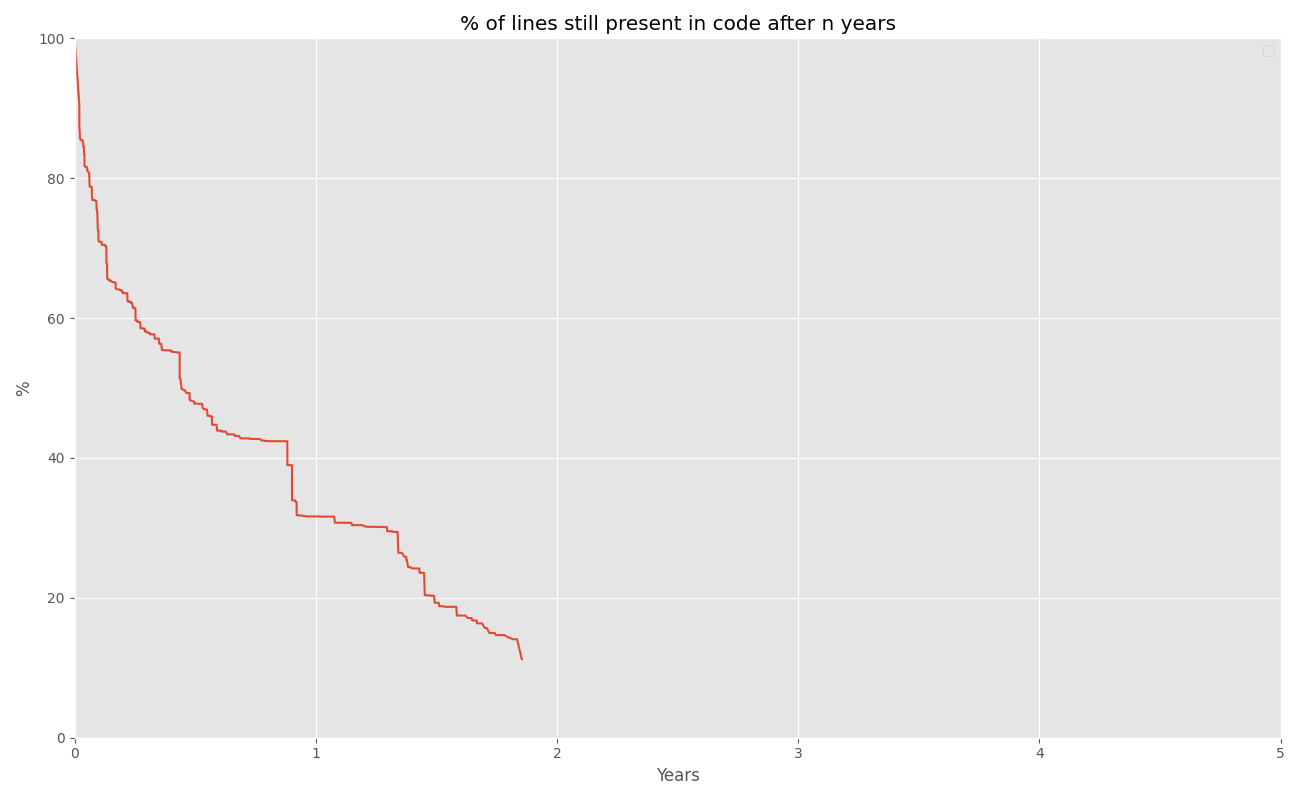
The first one is a multi-author affair. The second is maintained and written almost exclusively by me. It's a smaller repository (a few thousand lines of code as opposed to hundreds of thousands of lines) and I was learning a language as I went (that accounts for a lot of the rewriting). And - because it's all me - I think I'm more willing to rewrite blocks of code because I know exactly why they're there and I'm not concerned about insulting the previous author ...
But there's trouble in paradise. The default configuration of git-of-theseus completely ignores both Ansible repositories and documentation repositories. This is because the author of the program considers the files at their core to be "just" configuration and documentation. It ignores YML, YAML, TXT, and MD files (among others). Because of this, I've learned to generate the file extensions graph, and look at it FIRST, because it tells you what git-of-theseus is analysing - and ignoring.
Running it is very simple:
$ git-of-theseus-analyze <repo-name>
This generates four JSON files: authors.json, cohorts.json, exts.json, survival.json - although generating them can take several minutes. The JSON files are then turned into graphs:
$ git-of-theseus-stack-plot cohorts.json
...
$ git-of-theseus-survival-plot survival.json
...
$ git-of-theseus-stack-plot authors.json
...
$ git-of-theseus-stack-plot exts.json
...
I wrapped all of these into a single script. And - as mentioned previously - I've taken to checking exts.png first because it will tell you more than any of the others about how accurate the analysis has been.
You'd think that choosing file extensions would be part of the command line options, and on the surface it does appear to be. There are three options that suggest this is possible: --all-filetypes, --ignore ... and --only .... The choices seem odd to me: if you have an ignore, shouldn't you have an add? But nevertheless, it looks like between these, you can re-implement the file list as you like. Unfortunately, in practice I found that the only one I could make work was --all-filetypes. --ignore ... didn't ignore files - it just generated the same graph as before. --only ... ran without complaint and seemed to be working ... but generated empty graphs. A significant practical problem with --all-filetypes is that as soon as you add it, every JPG, PDF, and EXE that was accidentally or intentionally checked into the repository is now counted as tens of thousands of lines of code - it throws the statistics off horribly.
My partial solution to the problem was to edit /usr/local/lib/python3.8/site-packages/git_of_theseus/analyze.py (which may well be in another location on your system). The original author's comment was "Some filetypes in Pygments are not necessarily computer code, but configuration/documentation. Let's not include those." I have a philosophical disagreement with that statement: even if it's not code (and in the case of an Ansible repo, YML is definitely code), it's a contribution to the repository. So I commented out the original IGNORE line:
#IGNORE_PYGMENTS_FILETYPES = ['*.json', '*.md', '*.ps', '*.eps', '*.txt', '*.xml', '*.xsl', '*.rss', '*.xslt  ', '*.xsd', '*.wsdl', '*.wsf', '*.yaml', '*.yml']
# Add a dummy line, just to have something:
IGNORE_PYGMENTS_FILETYPES = ['*.xxxx', '*.yyyy']
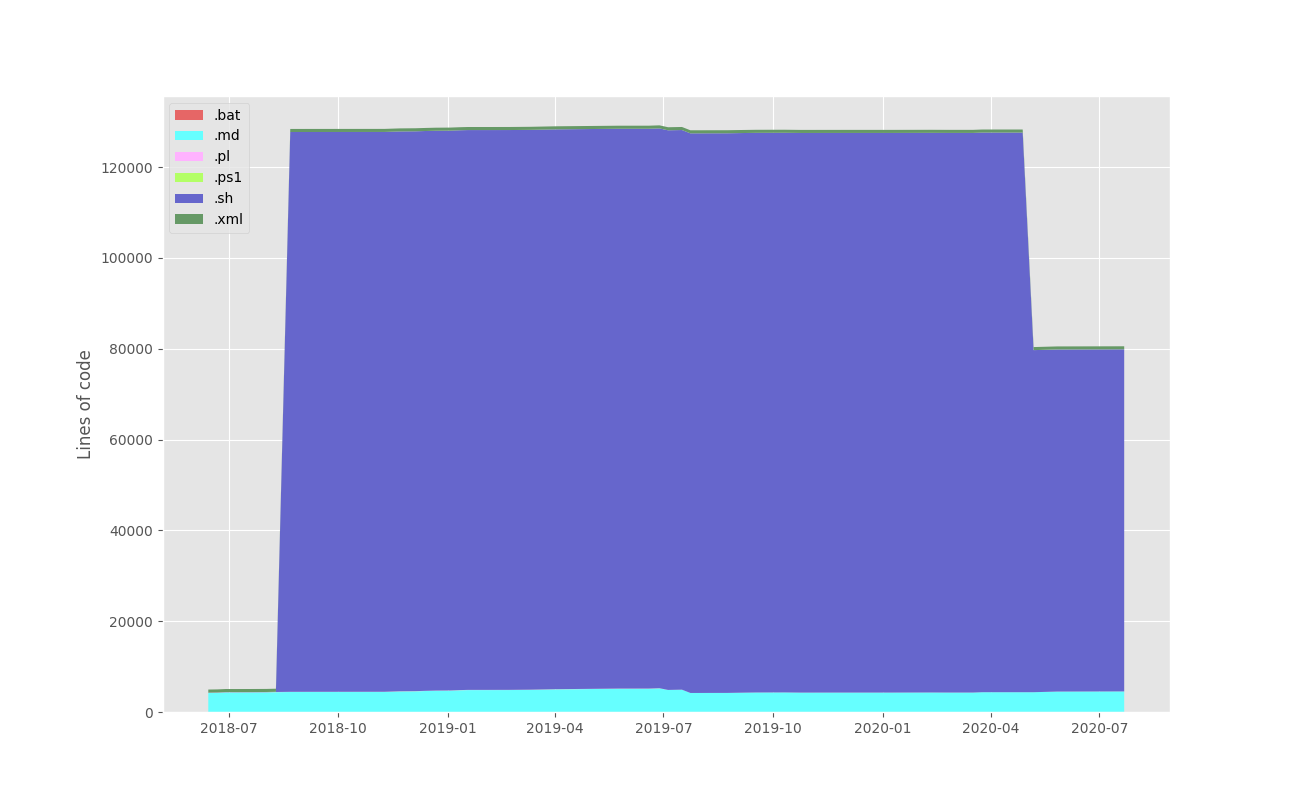
This mostly fixed the problem with the Ansible and documentation repositories, but did reveal a new one. Our documentation repository has a '.sh' file that's a self-extracting archive. git-of-theseus considers this to be about 120,000 lines of code. The rest of the repository is mostly MD files, amounting to about 5,000 lines of code, so that one shell file becomes the single biggest "contribution" to the repository and totally skews the stats - and, as I mentioned, I couldn't get --ignore '*.sh' to work at all.
graph: statistics poisoning by a self-extracting .sh file
Another strange difficulty occurred around author names. Surprisingly, the very first graph shown at the top worked perfectly for each of the authors. This is because the repository is actually an SVN repo converted to git, and the only names are login names and they're very consistent. But git lets you call yourself anything you want (and trust me, people do). In fact, I've used it to good effect to embed the name of each machine I'm on into my git username (eg. 'Giles Orr @ x2' for my Carbon X2). This is handy for my personal repos, and disruptive for my work repos. I appear as seven or eight slightly differently named authors. The git-of-theseus documentation casually mentions that you can set up a .mailmap file (they link to https://git-scm.com/docs/git-check-mailmap but provide NO other details) to disambiguate authors. I acknowledge that I haven't used git's mailmap before, but it's not complicated and I'm fairly sure I set it up correctly ... and git-of-theseus ignores it.
Despite some failings, git-of-theseus is a spectacularly educational tool that will tell you things about your repository you never even guessed at. Enjoy.
UPDATE 2020-07-28: A friend points out gource which generates movies from logged progress on a repository. It strikes me as being more like entertainment than education, but it's still very cool. It's also easier to use than git-of-theseus and available through (at least) the Fedora and Homebrew package managers.